Project 2: Modeling Data
HAA 96B Architecture Studio II: Connections
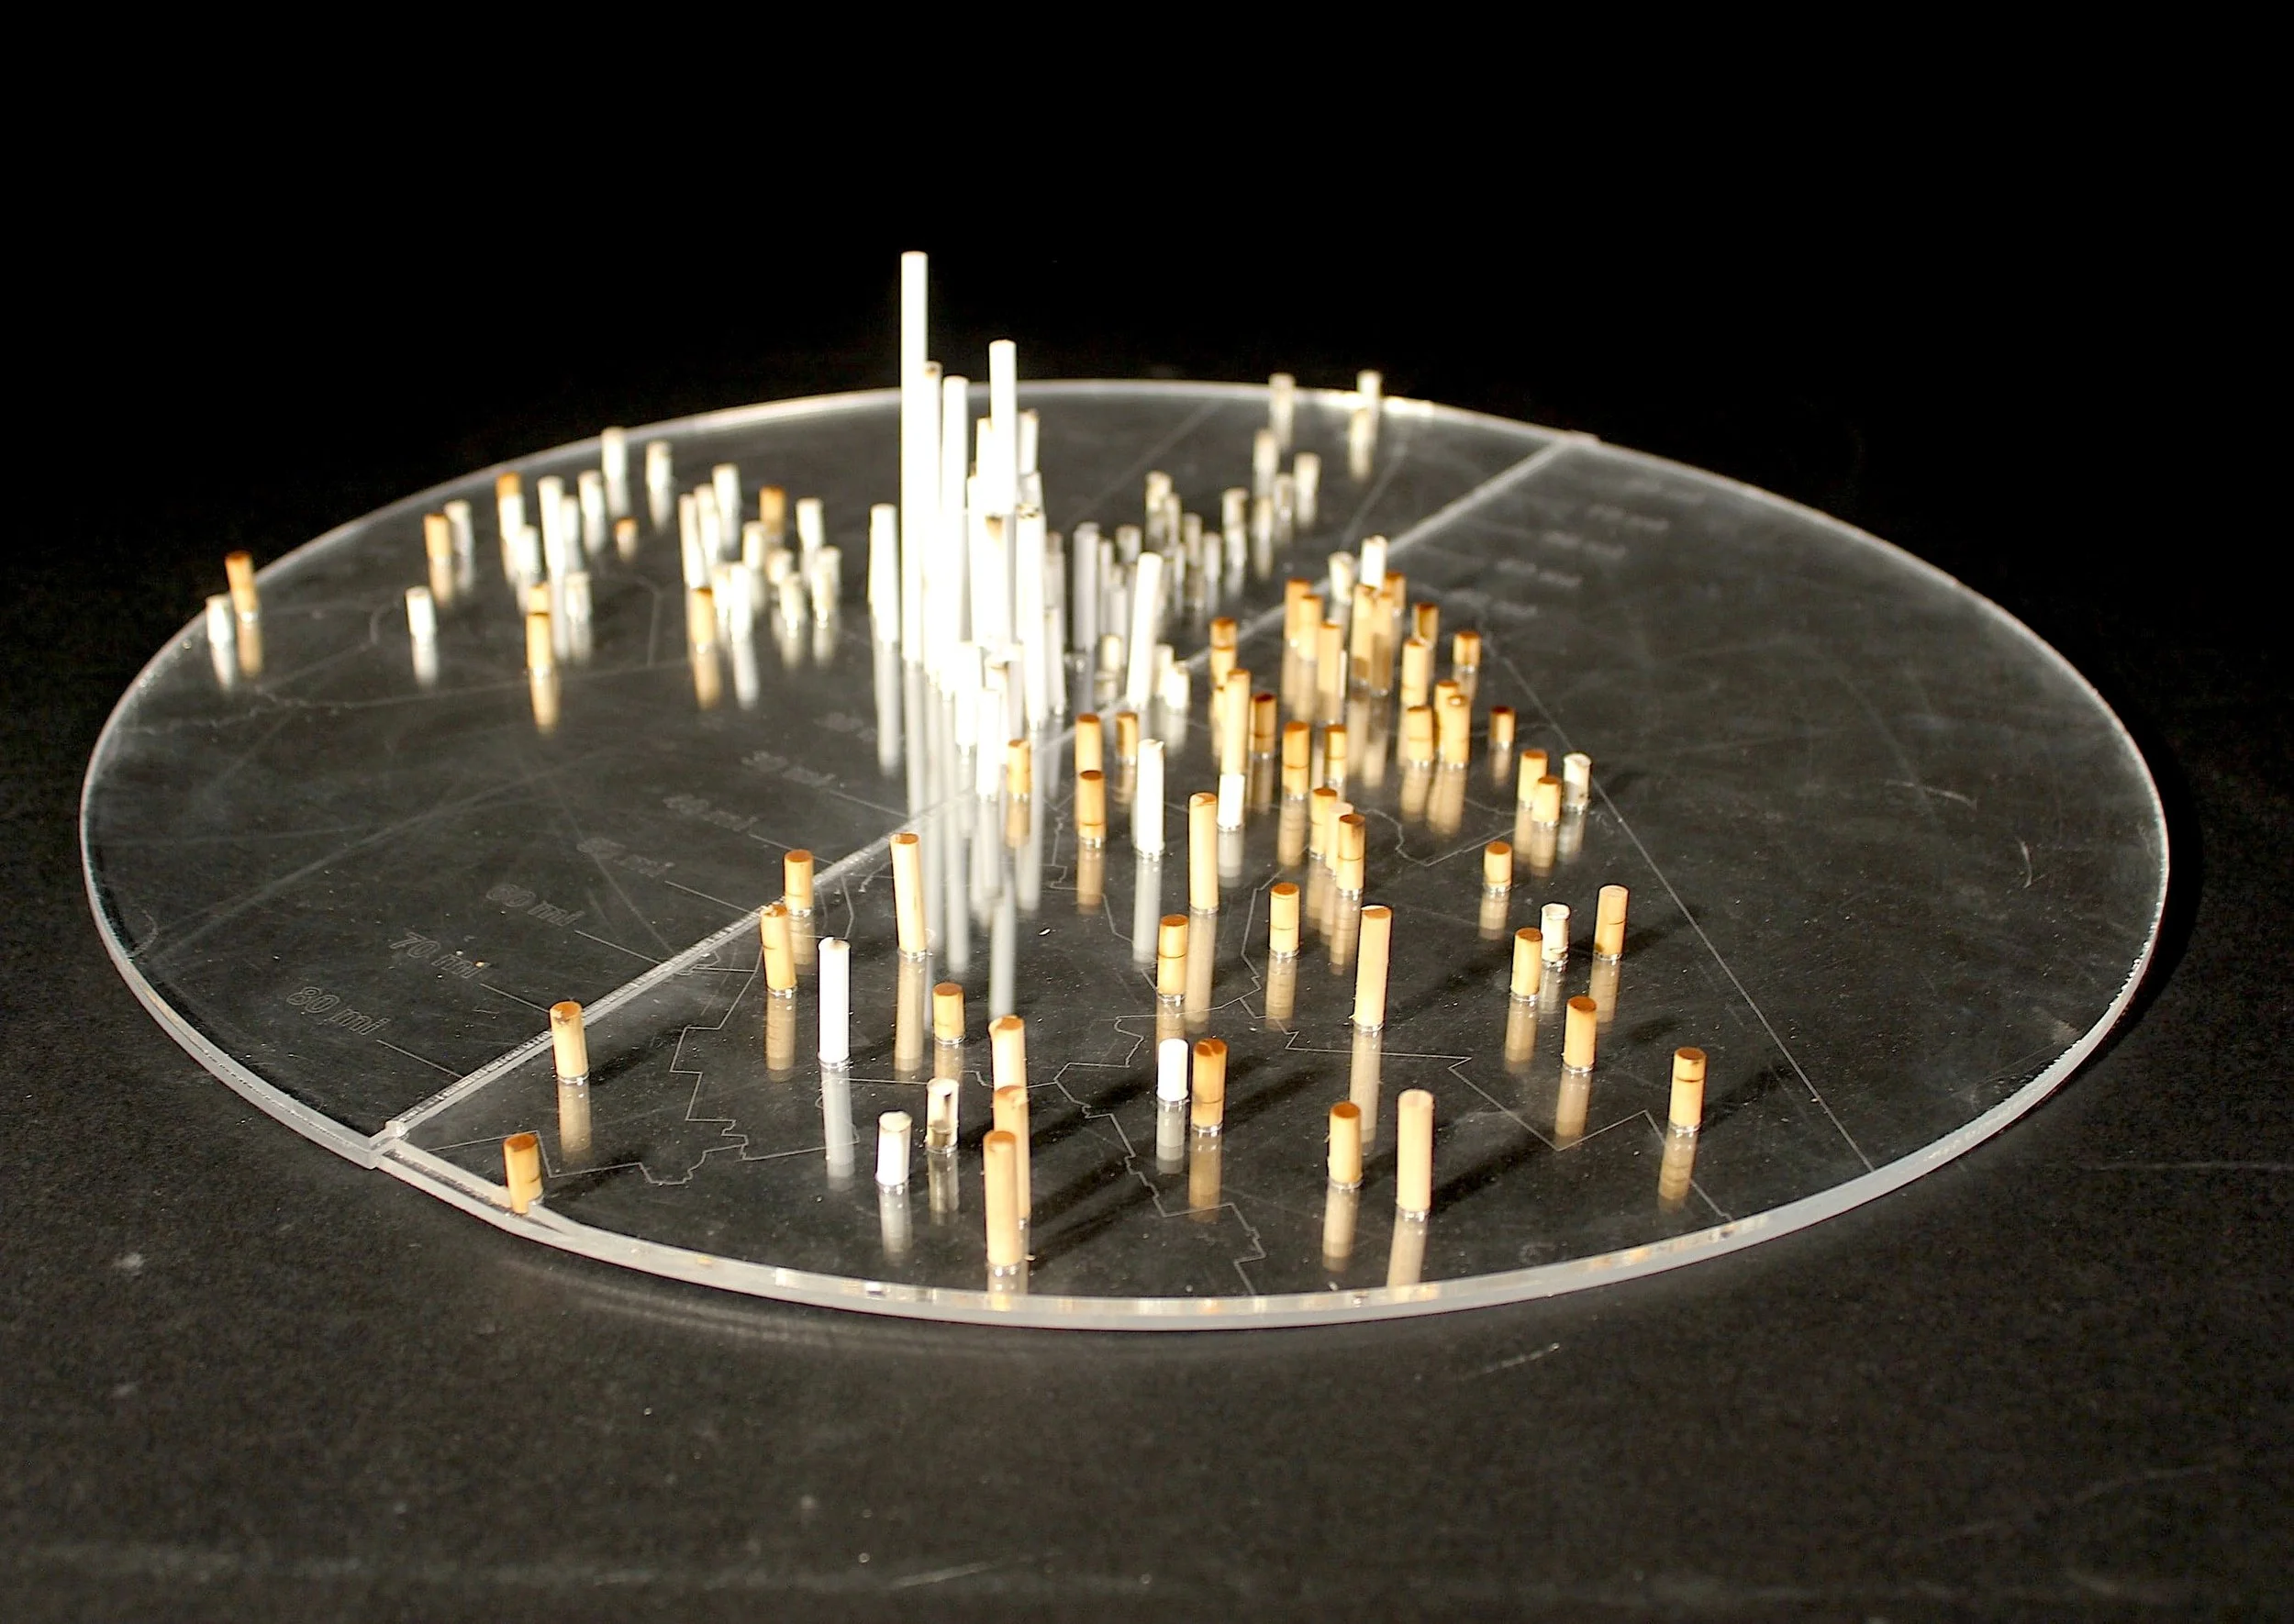
To understand the urban networks of food, the apple and drinking water were selected as case studies. Apple was examined in the context of New York City and surrounding area. Water was examined in the context of Portland, Maine and surrounding area. First, a half-circle area of the same scale and size was drawn as the study boundary. Within it, ArcGIS was used to collect three types of data: source, process, and product of each of the networks. From there, data points were aggregated into clusters based on data type and geographical proximity. In the physical model, each marker’s height noted the density of data points. In comparison, the metropolitan area of New York has a much higher concentration of product, while Portland has a higher concentration of source.